
Google has recently announced changes to sampling in the GA4 user interface, so this is another good reason why businesses should embrace big data. In this article, I talk about sampling and all the other benefits of using Google BigQuery over standard reporting.
What is Google Big Query?
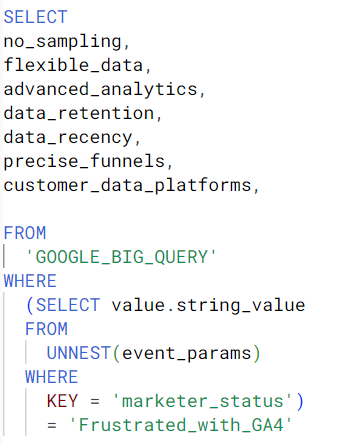
Google BigQuery is a way to access data stored in Google Cloud Platform via Structured Query Language (SQL) that allows lots of flexibility when analysing digital platforms.
BigQuery used to be part of Google Analytics 360, which enabled enterprise-level businesses to get their data out of GA. Now, with GA4, access to BigQuery is part of the free product that most businesses will have enabled. This is a huge advantage of the free version of GA4, as it enables all businesses the possibility to use data science to create value by breaking free of the GA4 user interface and really control their data like never before.
What are the benefits of Google Big Query?
No Sampling
Sampling in the GA4 interface adds another layer of ambiguity to reports in GA4 (on top of the in-built data modelling capabilities). Sampling will occur in GA4 properties with more than 10M events per query, a figure easily surpassed by many GA4 properties within any meaningful timeframe of data being queried.
This means that data exported to Looker Studio or transferred via the GA4 API, previously immune from sampling in the normal GA4 tables, will now be less accurate. This issue poses a challenge for analysts who heavily rely on the interface or Looker Studio, as increased stakeholder scrutiny regarding the accuracy and value of insights will arise due to fluctuating data.
The solution lies in migrating the data to BigQuery. There, you can query the data in its pure form, devoid of any sampling, data modelling, or thresholding occurring in the GA4 backend. This shift enables the freedom to manipulate your data however you prefer. As of November 2023, relying solely on the GA4 interface for serious data analytics is no longer a viable option.
Data retention in BigQuery is indefinite
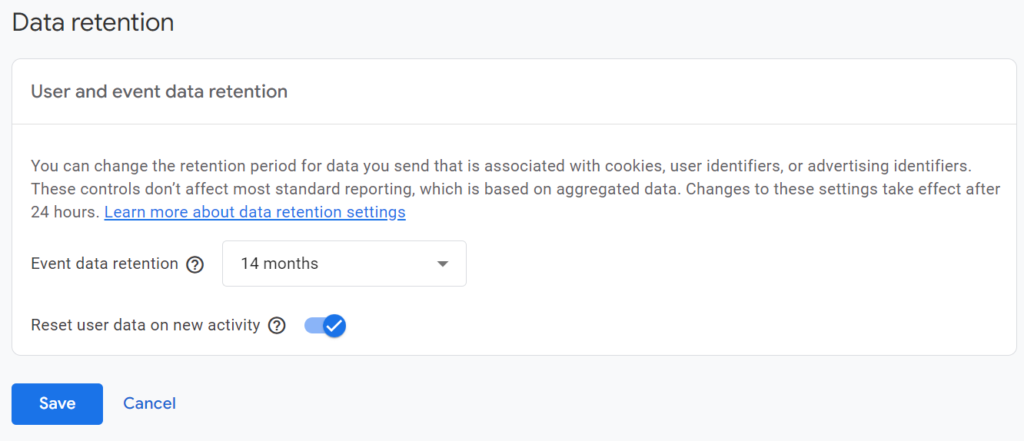
The Google Cloud Platform has the capability to indefinitely store data, provided billing is enabled. In contrast, GA4 allows access to a maximum of 14 months’ worth of data from the current date, with a default setting of 2 months. While this duration works for year-on-year analysis, it falls short of supporting robust multi-year analytics necessary for benchmarking or forecasting purposes.
Data recency in BigQuery can be instant
In GA4, accessing the previous day’s data typically isn’t available until midday. Even when data populates, it remains subject to potential changes due to backend behavioural modelling. Google notes that these alterations can persist up to 72 hours after the initial data collection. Consequently, exporting the same data table 24 hours apart might yield different results, even without altering the parameters.
BigQuery offers a solution to this issue by allowing querying of intraday (streaming) tables for instant event flow into a dashboard. However, it’s worth noting that source/medium data isn’t included in the intraday tables. As a result, insights regarding attribution may require waiting (which is crucial to ensure accurate attribution anyway).
While prioritising short-term focus in analytics isn’t typically what I would recommend, real-time exports prove useful for specific tasks such as quality assurance on an implementation or investigating traffic spikes. This capability is invaluable for data analysts, especially when data accessibility is hindered by the GA4 processing limitations..
Join to other datasets, like your customer database
Digital analytics can become very sophisticated when we join our unique user IDs collected in the process of a sale or a generated lead. We can use this to tie together onsite and offsite behaviour and calculate a true lifetime value and attribution model as part of a 1st party data strategy fuelling robust customer relationship management and personalisation.
Big query can ingest tables from any customer database, and this is where data science gets very interesting, as insight can generate meaningful action outside of the digital platform, and can evoke change on the entire customer acquisition and retention strategies.
Get conversion rates for user segments on the fly
A significant frustration within the confines of the GA4 interface is the inability to create reliable, unsampled audiences for real-time conversion rate analysis of specific event types. Options within GA4 force a choice between creating an audience and waiting for retrospective data (as it isn’t retroactive), or using the exploration tool, often encountering highly sampled and less reliable data.
In contrast, BigQuery offers the ability to dynamically generate segments on-the-fly, allowing for unsampled, robust queries that can be utilized repeatedly for reports or spontaneous insights. This flexibility allows for detailed examination of event parameters to derive highly specific audiences and their corresponding conversion rates, eliminating the need to wait for custom dimensions to populate.
For example, consider analysing the conversion rate of on-site searches on an ecommerce website. The GA4 UI lacks the ability to easily ‘sessionise’ metrics related to site searches, a feature more accessible in the previous UA (Universal Analytics).
Using BigQuery, we can delve deeper by segmenting this data by search terms, further dissecting resulting purchases associated with each term. This detailed analysis reveals product relationships and common product swaps from search to purchase, shedding light on user behaviour and preferences.
In BigQuery, your data is very flexible
- There’s no need to wait for custom dimensions to be populated. One of the most frustrating aspects for analysts in GA4 is configuring event parameters in Google Tag Manager, only to forget setting up a corresponding custom dimension in the GA4 interface. This delay hampers immediate access to the data. However, in BigQuery, parameters can be queried without requiring pre-established custom dimensions; they appear directly in the tables.
- You can define any metric however you like. You might prefer using specific definitions for volume and conversions. Personally, I opt for the definition of “users who converted” where appropriate, rather than a raw event count. Additionally, if you can attach a unique user ID to your conversion event, you can deduplicate events, associating them with real individuals through UUID values. This practice enables reports that closely align with the reality within GA4. Also, the capability to exclude certain characteristics from session or user counts exists within GA4, although these settings can be somewhat obscure within the settings menus. Consequently, when assessing data quality, it’s challenging to work out which factors are impacting the data and which are not. Having the data filtered in SQL code that is easily readable in the where clause is far simpler for debugging.
- Get “sessionised” funnels – true funnel metrics with accurate dropout rates. BigQuery facilitates the creation of “sessionised” funnels, providing accurate funnel metrics with precise dropout rates. Utilising funnel metrics in GA4, such as “Add to Carts,” “Checkouts,” or “Item Views,” might not be the most effective method to gauge funnel effectiveness. Often, reports using these metrics can be misleading because they fail to count the unique occurrences of an event within a session or user interaction, resulting in inaccuracies.
What do we mean by funnel metrics?
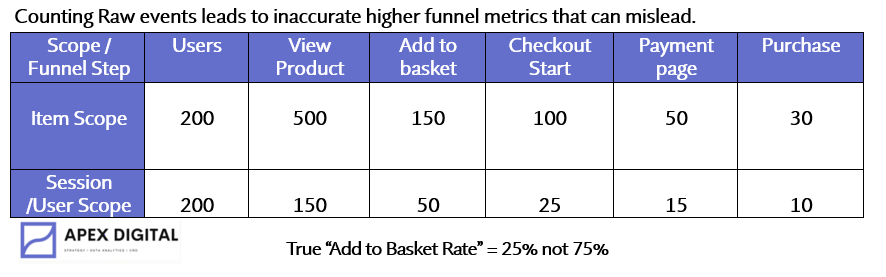
For example, if a user views 10 products, adds 3 products to basket, begins a checkout and then abandons at the checkout page, we would need to analyse this is a certain way. We should not take the raw count of “items viewed” because this will just sum all the events as they occurred.
This would be relevant if we were looking at the problem at an item scope, but if we just want to determine the effectiveness of the funnel, for example, “what percentage of users view at least one product?” then we need to count distinct the users with item view events. This type of analysis cannot be done effectively in the GA4 interface, and provides so much more clarity when analysing websites.
Conclusion
In conclusion, integrating Google BigQuery into your digital analytics tech stack is now more crucial than ever. Recent changes in Google Analytics 4 (GA4) have introduced challenges related to sampling, data retention, recency, and data flexibility that highlight the limitations of relying solely on the GA4 user interface.
Embracing Google BigQuery as a central component of your analytics infrastructure grants unparalleled flexibility, precision, and control over your data. It not only mitigates the limitations imposed by GA4 but also unlocks a realm of possibilities for comprehensive analysis, paving the way for more informed decision-making and transformative insights into your digital platforms.
Hire me to migrate your digital data into google BigQuery, and set yourself free from unreliable reporting and insight.

Read on
Connect with me on LinkedIn